티스토리 뷰
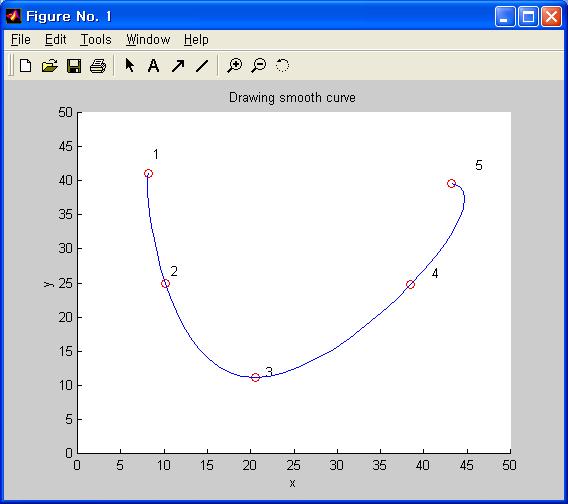
% file name : g_spline : ginput함수와 spline함수를 사용하여 interpolation하는 곡선을 그린다.
clear all
clf
v=[0 50 0 50];
axis(v);
hold on;
x=[];
y=[];
n=0;
button=1;
title('Drawing smooth curve');
xlabel('x');
ylabel('y');
while button==1
[xi,yi,button]=ginput(1); %마우스로 클릭한 좌표를 받는다.
plot(xi,yi,'ro'); %마우스로 클릭한 좌표에 o를 찍는다.
text(xi+(xi)/15,yi+(yi)/15,int2str(n+1)); %몇번째로 클릭한 것인지 숫자를
n=n+1; %카운트해서 찍는다.
x(n,1)=xi; %spline함수의 사용을 위해서 x벡터를 만든다.
y(n,1)=yi; %y벡터를 만든다.
end
t=1:n;
ts=1:0.1:n;
xs=spline(t,x,ts);
ys=spline(t,y,ts);
plot(xs,ys,'b-'); %전체 점을 spline곡선으로 연결한다.
hold off
결과

'Mathematics > MATLAB' 카테고리의 다른 글
| 1.3 (예) subplot에 대한 예제 (0) | 2008.08.18 |
|---|---|
| 1.3 MATLAB에서의 그래픽 (0) | 2008.08.18 |
| 1.2 연습문제 (0) | 2008.08.18 |
